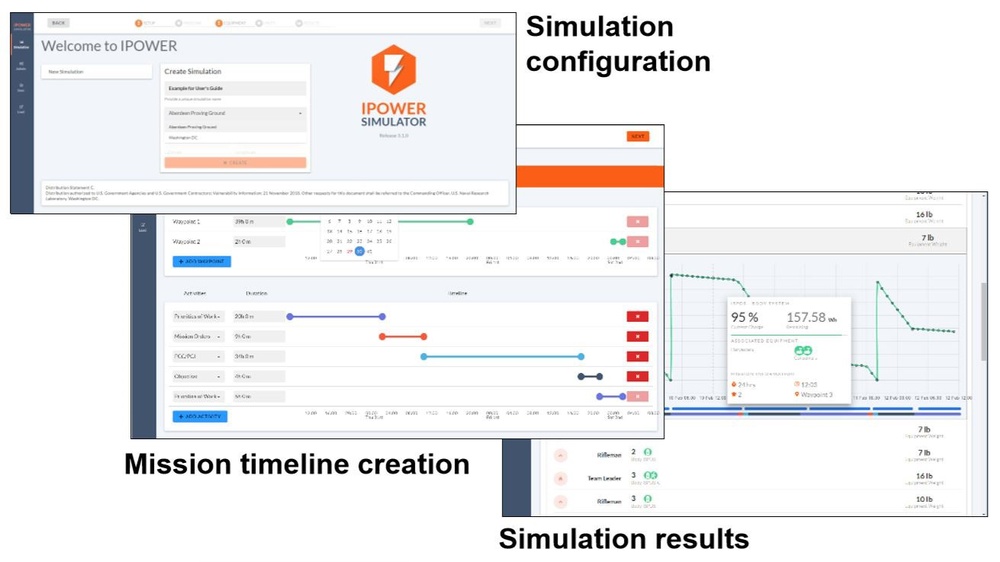
Images show the IPOWER setup page (top), Missions page where the mission start date and time and timeline are defined (middle), and a portion of the Results page where outputs are displayed (bottom). The results are communicated through interactive plots, graphs, and tables with pop-ups to show details.
| Date Taken: | 03.23.2021 |
| Date Posted: | 03.23.2021 15:20 |
| Photo ID: | 6567845 |
| VIRIN: | 210323-N-NO204-001 |
| Resolution: | 1311x737 |
| Size: | 251.24 KB |
| Location: | US |
| Web Views: | 18 |
| Downloads: | 4 |

This work, IPOWER: Improving your energy-informed decisions when it matters most, by U.S. Naval Research Laboratory, identified by DVIDS, must comply with the restrictions shown on https://www.dvidshub.net/about/copyright.