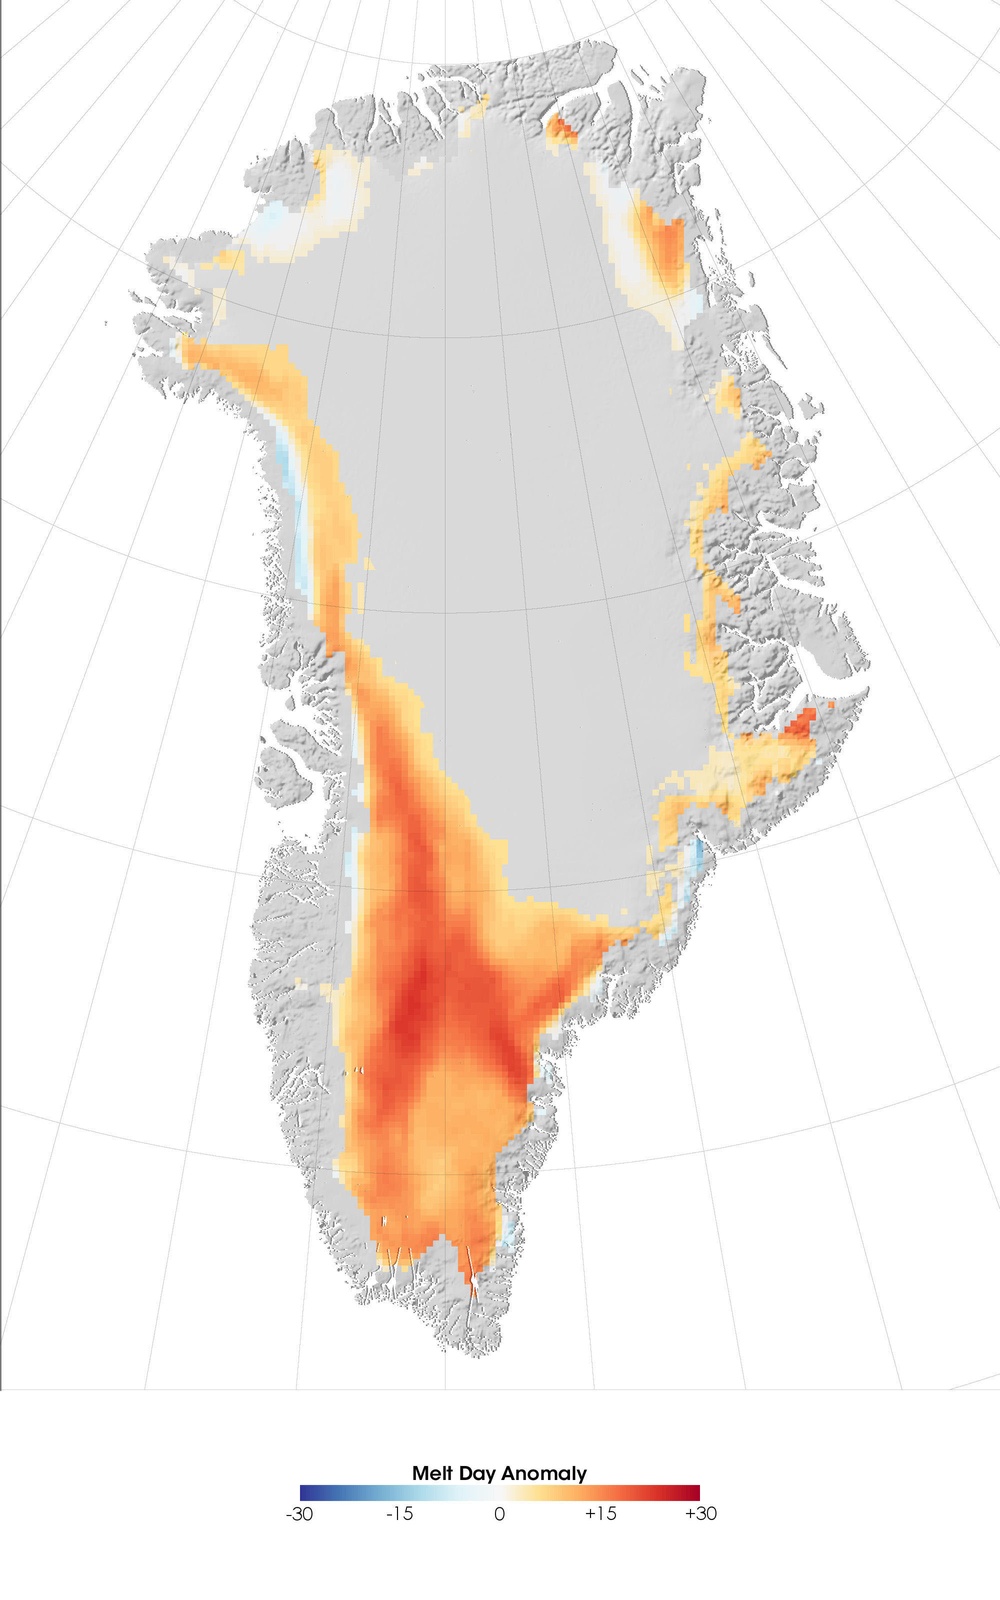
The year 2007 marked an overall rise in the summertime melting trend over the highest altitudes of the Greenland ice sheet. Melting in areas above 2,000 meters (about 6,560 feet) rose 150 percent above the long-term average, with melting occurring on 25-30 more days in 2007 than the average in the previous 19 years.
This image shows the Greenland melt anomaly, measured as the difference between the number of days on which melting occurred in 2007 compared to the average annual melting days from 1988-2006. The areas with the highest amounts of additional melt days appear in red, and areas with below-average melt days appear in blue. Although faint streaks of blue appear along the coastlines, namely in northwestern and southeastern Greenland, red and orange predominate, especially in the south.
This image is based on microwave-frequency data from the Special Sensor Microwave/Imager (SSM/I) on the Defense Meteorological Satellite Program. Snow and ice naturally emit microwave energy, but the signal is very different for dry versus wet snow. These differences allow sensors to detect the presence of melting snow on the surface of the ice sheet as well as deeper in the snow and ice pack.
In addition to calculating Greenland's melting day anomaly, Marco Tedesco, a research scientist at the Joint Center for Earth Systems Technology, also calculated a -- a scale created by multiplying the number of days that melting took place by the area where melting occurred. Melting index in April and May of 2007 in high-altitude areas was very low, but in June melting jumped unexpectedly and remained high for the rest of the summer. The melting index in lower altitude areas of Greenland in 2007 was also higher than average by 30 percent, though it did not break any record. Over the entire sheet, the year 2007 fell at fifth place for the highest melting index on record, after 2005, 2002, 1998 and 2004.
Increasing melting snow over Greenland can influence the Earth in several ways. Aside from contributing to direct sea level rise, melting -- especially along the coast -- can speed up glaciers since the meltwater can percolate down to the ice-bedrock interface, acting as a lubricant between the ice and the bedrock. The faster glaciers flow, the more water enters the ocean and the greater the potential for sea level rise. Although some of the snow melting at high elevations is unlikely to reach the ocean, melting snow at high altitudes can still affect Earth's energy budget. Melted and refrozen snow can absorb up to four times more energy than fresh, unthawed snow. As a result, snow melt can change the amount of solar radiation the Earth absorbs versus the amount it reflects.
Image and interpretation by Marco Tedesco, Joint Center for Earth Systems Technology, NASA Goddard Space Flight Center, University of Maryland at Baltimore County.
| Date Taken: | 07.11.2011 |
| Date Posted: | 02.08.2013 15:19 |
| Photo ID: | 851757 |
| Resolution: | 2000x3200 |
| Size: | 562.88 KB |
| Location: | WASHINGTON, D.C., US |
| Web Views: | 16 |
| Downloads: | 1 |
