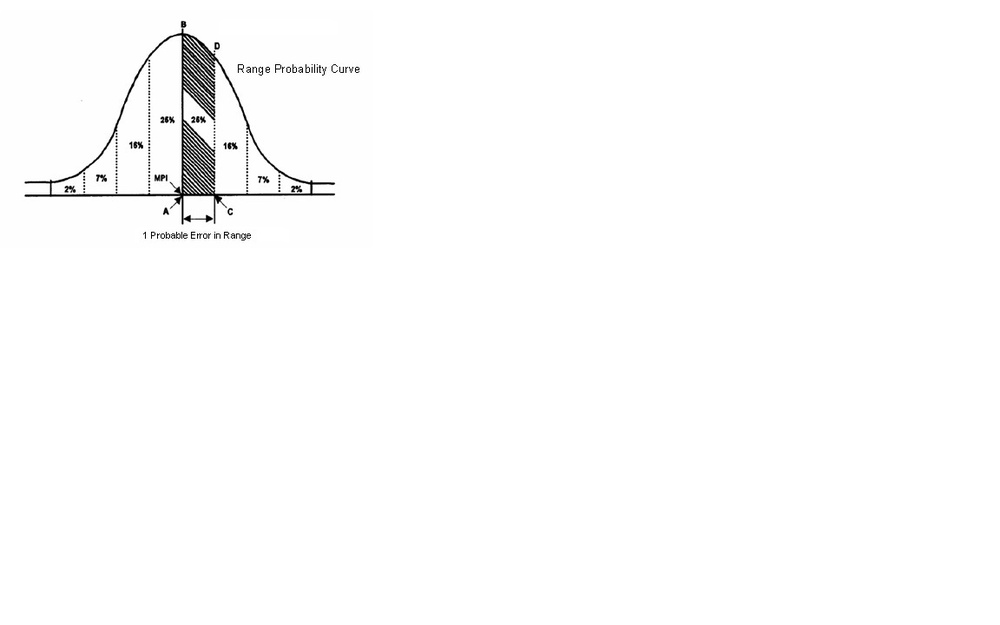
Figure 3: Cumulative normative distribution of range dispersions for any given collection of rounds fired with the same firing data. Standard deviation in this illustration is mathematically converted to probable error (PE). All errors fall within +/- 5.8 PE of the mean. Source: FT 155-AR-2.
| Date Taken: | 04.18.1996 |
| Date Posted: | 04.21.2016 11:44 |
| Photo ID: | 2544681 |
| VIRIN: | 960418-A-YD137-001-CC |
| Resolution: | 1152x720 |
| Size: | 35.73 KB |
| Location: | US |
| Web Views: | 30 |
| Downloads: | 1 |

This work, Range Probability Curve [Image 5 of 5], by Monica Wood, identified by DVIDS, must comply with the restrictions shown on https://www.dvidshub.net/about/copyright.