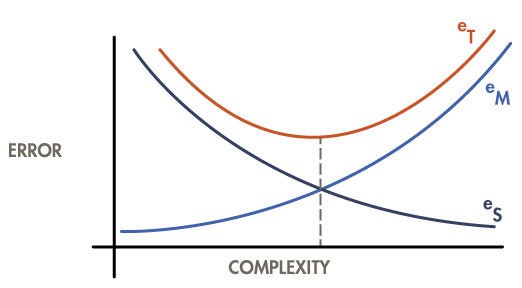
Leinweber’s model-error illustration shows that the minimum total model error results from the trade-off between decreasing model error (eS) from increasing model specificity (eT) and measurement error from increased computation on imperfect data (eM). (SOURCE: “Models, Complexity, and Error. A RAND Note prepared for the U.S. Department of Energy,” by David Leinweber, 1979)
| Date Taken: | 05.01.2019 |
| Date Posted: | 07.08.2019 21:25 |
| Photo ID: | 5562064 |
| VIRIN: | 190708-A-A4416-004 |
| Resolution: | 522x288 |
| Size: | 17.1 KB |
| Location: | US |
| Web Views: | 62 |
| Downloads: | 2 |

This work, FIGURE 1 - MODEL ERROR [Image 2 of 2], must comply with the restrictions shown on https://www.dvidshub.net/about/copyright.