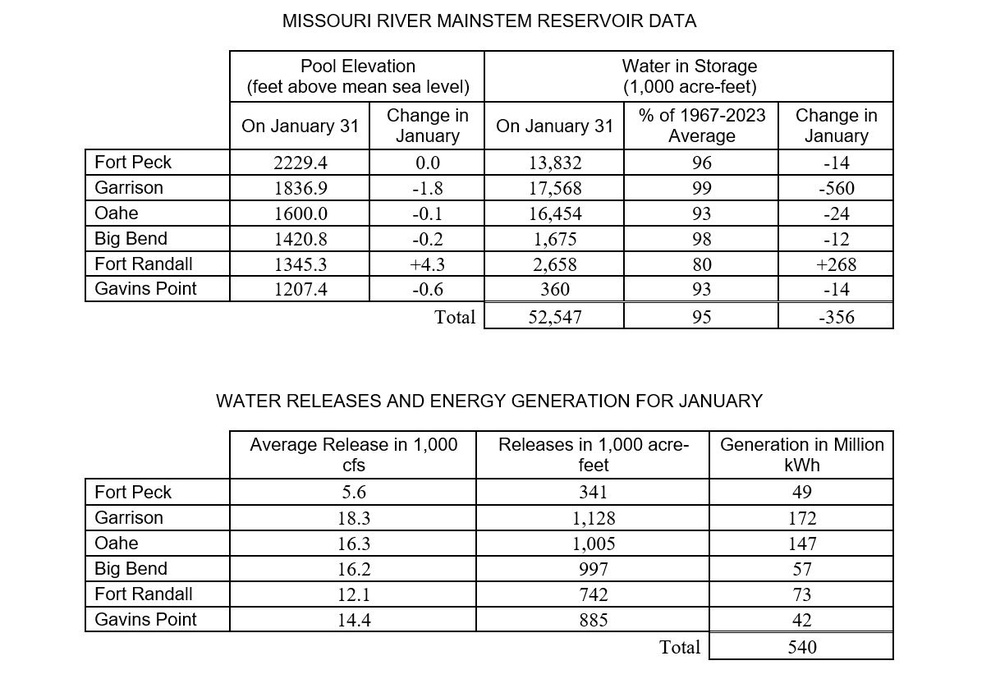
MISSOURI RIVER MAINSTEM RESERVOIR DATA
Pool Elevation
(feet above mean sea level) Water in Storage
(1,000 acre-feet)
On January 31 Change in January On January 31 % of 1967-2023 Average Change in January
Fort Peck 2229.4 0.0 13,832 96 -14
Garrison 1836.9 -1.8 17,568 99 -560
Oahe 1600.0 -0.1 16,454 93 -24
Big Bend 1420.8 -0.2 1,675 98 -12
Fort Randall 1345.3 +4.3 2,658 80 +268
Gavins Point 1207.4 -0.6 360 93 -14
Total 52,547 95 -356
WATER RELEASES AND ENERGY GENERATION FOR JANUARY
Average Release in 1,000 cfs Releases in 1,000 acre-feet Generation in Million kWh
Fort Peck 5.6 341 49
Garrison 18.3 1,128 172
Oahe 16.3 1,005 147
Big Bend 16.2 997 57
Fort Randall 12.1 742 73
Gavins Point 14.4 885 42
Total 540
| Date Taken: | 02.01.2024 |
| Date Posted: | 02.05.2024 11:45 |
| Photo ID: | 8225457 |
| VIRIN: | 240201-A-RO090-6270 |
| Resolution: | 1218x827 |
| Size: | 137.77 KB |
| Location: | OMAHA, NEBRASKA, US |
| Web Views: | 39 |
| Downloads: | 1 |

This work, Below average runoff forecast for the upper Missouri River Basin in 2024 [Image 2 of 2], by Eileen Williamson, identified by DVIDS, must comply with the restrictions shown on https://www.dvidshub.net/about/copyright.