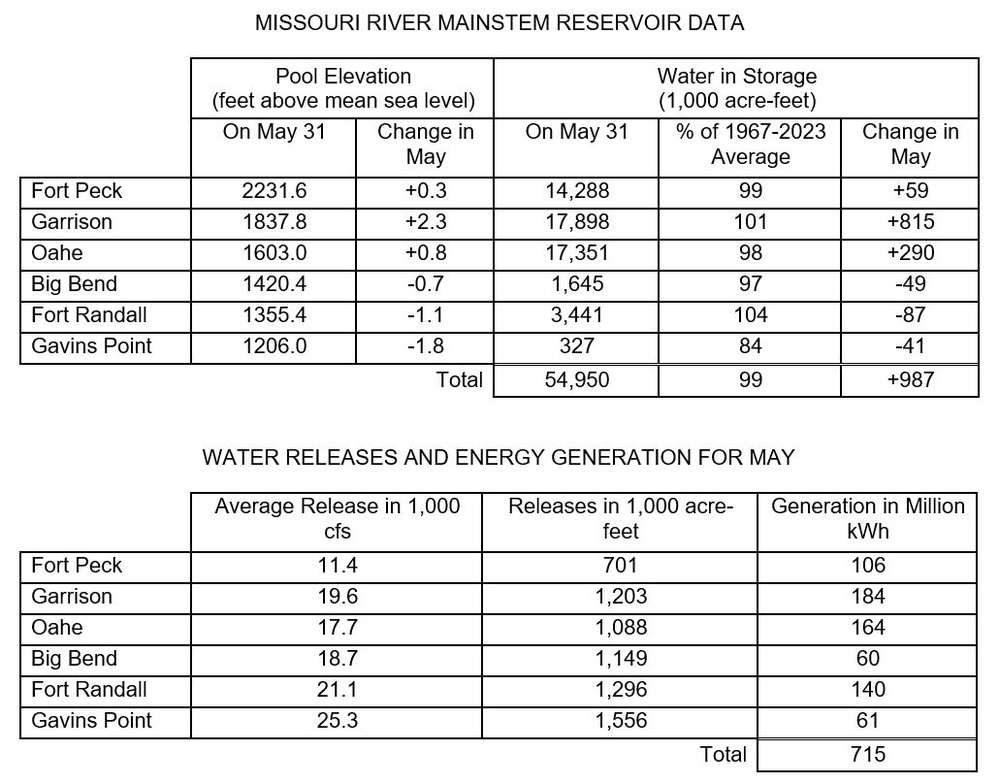
MISSOURI RIVER MAINSTEM RESERVOIR DATA Pool Elevation (feet above mean sea level) On May 31 Change in May Water in Storage (1,000 acre-feet) On May 31 % of 1967-2023 Average Change in May Fort Peck 2231.6 +0.3 14,288 99 +59 Garrison 1837.8 +2.3 17,898 101 +815 Oahe 1603.0 +0.8 17,351 98 +290 Big Bend 1420.4 -0.7 1,645 97 -49 Fort Randall 1355.4 -1.1 3,441 104 -87 Gavins Point 1206.0 -1.8 327 84 -41 Total 54,950 99 +987 WATER RELEASES AND ENERGY GENERATION FOR MAY Average Release in 1,000 cfs Releases in 1,000 acre-feet Generation in Million kWh Fort Peck 11.4 701 106 Garrison 19.6 1,203 184 Oahe 17.7 1,088 164 Big Bend 18.7 1,149 60 Fort Randall 21.1 1,296 140 Gavins Point 25.3 1,556 61 Total 715
| Date Taken: | 06.04.2024 |
| Date Posted: | 06.04.2024 15:27 |
| Photo ID: | 8449730 |
| VIRIN: | 240604-A-RO090-5059 |
| Resolution: | 1031x808 |
| Size: | 131.8 KB |
| Location: | OMAHA, NEBRASKA, US |
| Web Views: | 34 |
| Downloads: | 0 |

This work, May runoff slightly above average; Fort Peck flow test continues [Image 2 of 2], by Eileen Williamson, identified by DVIDS, must comply with the restrictions shown on https://www.dvidshub.net/about/copyright.