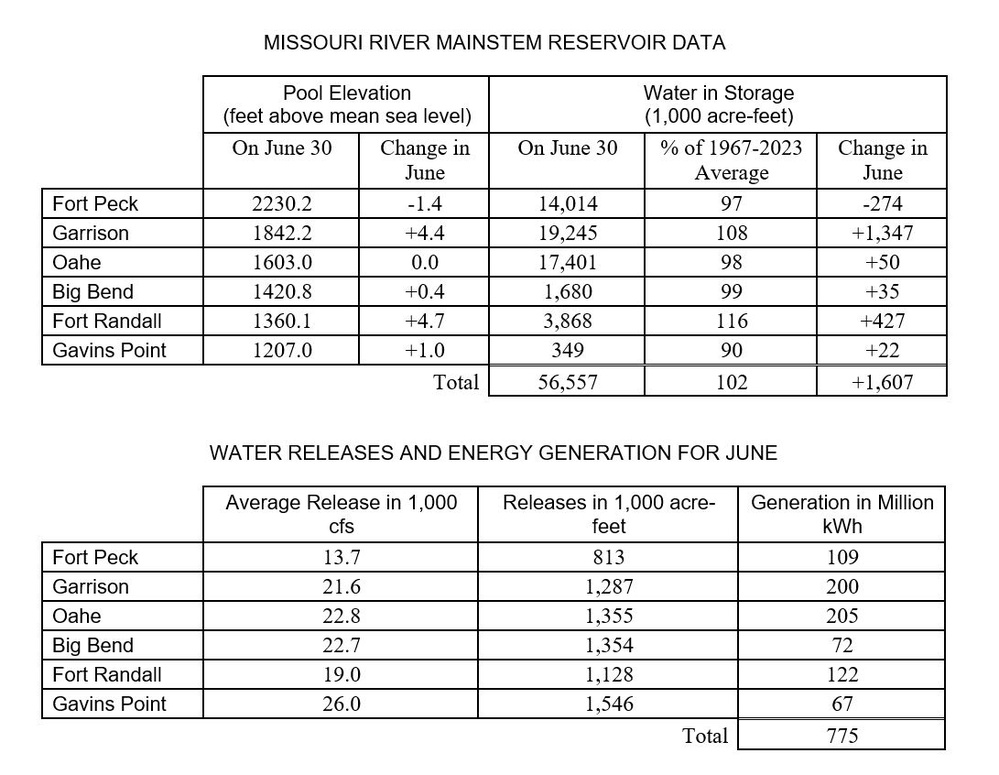
MISSOURI RIVER MAINSTEM RESERVOIR DATA Pool Elevation (feet above mean sea level) Water in Storage (1,000 acre-feet) On June 30 Change in June On June 30 % of 1967-2023 Average Change in June Fort Peck 2230.2 -1.4 14,014 97 -274 Garrison 1842.2 +4.4 19,245 108 +1,347 Oahe 1603.0 0.0 17,401 98 +50 Big Bend 1420.8 +0.4 1,680 99 +35 Fort Randall 1360.1 +4.7 3,868 116 +427 Gavins Point 1207.0 +1.0 349 90 +22 Total 56,557 102 +1,607 WATER RELEASES AND ENERGY GENERATION FOR JUNE Average Release in 1,000 cfs Releases in 1,000 acre-feet Generation in Million kWh Fort Peck 13.7 813 109 Garrison 21.6 1,287 200 Oahe 22.8 1,355 205 Big Bend 22.7 1,354 72 Fort Randall 19.0 1,128 122 Gavins Point 26.0 1,546 67 Total 775
| Date Taken: | 07.04.2024 |
| Date Posted: | 07.04.2024 15:27 |
| Photo ID: | 8515039 |
| VIRIN: | 240704-A-RO090-6050 |
| Resolution: | 1091x846 |
| Size: | 147.65 KB |
| Location: | OMAHA, NEBRASKA, US |
| Web Views: | 7 |
| Downloads: | 1 |

This work, System operations returning to normal post flooding [Image 2 of 2], by Eileen Williamson, identified by DVIDS, must comply with the restrictions shown on https://www.dvidshub.net/about/copyright.