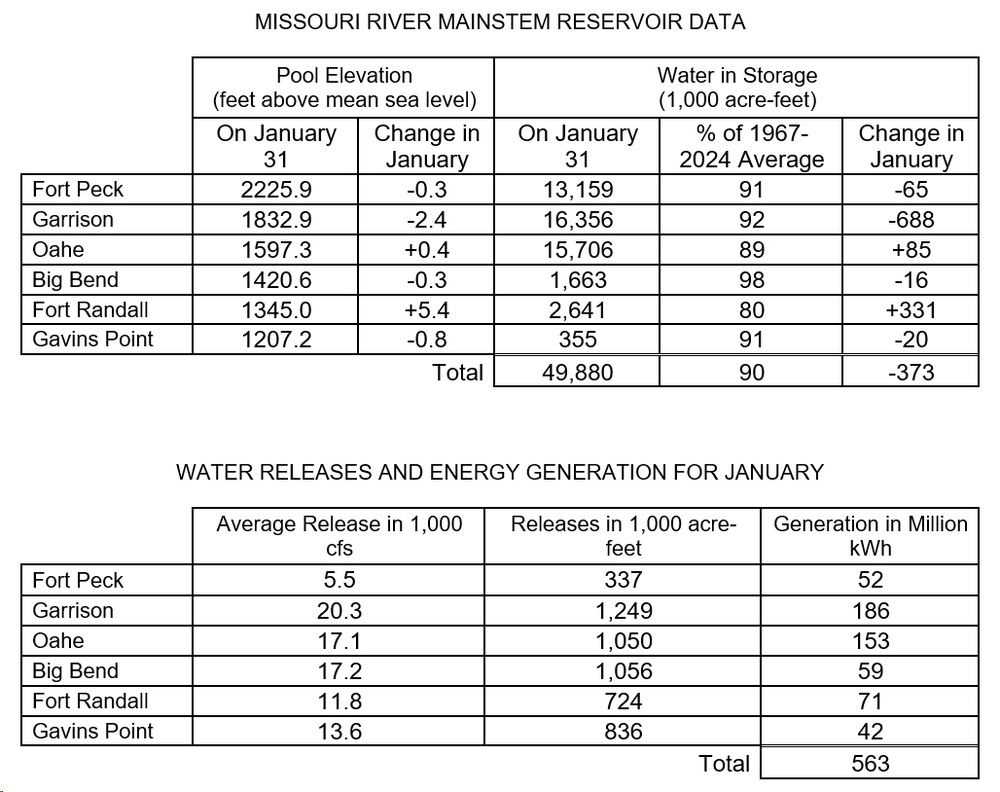
MISSOURI RIVER MAINSTEM RESERVOIR DATA Pool Elevation (feet above mean sea level) Water in Storage (1,000 acre-feet) On January 31 Change in January On January 31 % of 1967-2024 Average Change in January Fort Peck 2225.9 -0.3 13,159 91 -65 Garrison 1832.9 -2.4 16,356 92 -688 Oahe 1597.3 +0.4 15,706 89 +85 Big Bend 1420.6 -0.3 1,663 98 -16 Fort Randall 1345.0 +5.4 2,641 80 +331 Gavins Point 1207.2 -0.8 355 91 -20 Total 49,880 90 -373 WATER RELEASES AND ENERGY GENERATION FOR JANUARY Average Release in 1,000 cfs Releases in 1,000 acre-feet Generation in Million kWh Fort Peck 5.5 337 52 Garrison 20.3 1,249 186 Oahe 17.1 1,050 153 Big Bend 17.2 1,056 59 Fort Randall 11.8 724 71 Gavins Point 13.6 836 42 Total 563
| Date Taken: | 02.06.2025 |
| Date Posted: | 02.06.2025 09:28 |
| Photo ID: | 8859130 |
| VIRIN: | 250206-A-RO090-5255 |
| Resolution: | 1028x814 |
| Size: | 302.97 KB |
| Location: | OMAHA, NEBRASKA, US |
| Web Views: | 4 |
| Downloads: | 1 |

This work, 250205-A-A1408-002.j [Image 2 of 2], by Eileen Williamson, identified by DVIDS, must comply with the restrictions shown on https://www.dvidshub.net/about/copyright.